Troubleshooting Memory Leaks
Introduction
This article provides some suggestions for diagnosing problems involving possible memory leaks.
If your application’s execution time becomes longer, or if the operating system seems to be performing slower, this could be an indication of a memory leak. In other words, virtual memory is being allocated but is not being returned when it is no longer needed. Eventually the application or the system runs out of memory, and the application terminates abnormally.
Table of Contents
- 1 The java.lang.OutOfMemoryError Error
- 1.1 Detail Message: Java heap space
- 1.2 Detail Message: GC Overhead limit exceeded
- 1.3 Detail Message: Requested array size exceeds VM limit
- 1.4 Detail Message: Metaspace
- 1.5 Detail Message: request <SIZE> bytes for <REASON>. Out of swap space?
- 1.6 Detail Message: Compressed class space
- 1.7 Detail Message: <REASON> <STACK_TRACE> (Native method)
- 2 Detecting a Memory Leak
- 3 Diagnosing Java Memory Leaks
- 4 Diagnosing Native Memory Leaks
- 5 Monitoring the Objects Pending Finalization
- 6 Troubleshooting a Crash Instead of a java.lang.OutOfMemoryError error
1 The java.lang.OutOfMemoryError Error
One common indication of a memory leak is the
java.lang.OutOfMemoryError error. This error indicates that the
garbage collector cannot make space available to accommodate a new
object, and the heap cannot be expanded further. This error may also be
thrown when there is insufficient native memory to support the loading
of a Java class. In rare instances, the error is thrown when an
excessive amount of time is being spent performing garbage collection,
and little memory is being freed.
The java.lang.OutOfMemoryError error can also be thrown by native
library code when a native allocation cannot be satisfied (for example,
if swap space is low).
A stack trace is printed when a java.lang.OutOfMemoryError error is
thrown.
An early step to diagnose a java.lang.OutOfMemoryError error is to
determine its cause. Was it thrown because the Java heap is full or
because the native heap is full? To help you discover the cause, a
detail message is appended to the text of the exception, as shown in
the following examples:
1.1 Detail Message: Java heap space
Cause: The detail message Java heap space indicates that an object
could not be allocated in the Java heap. This error does not necessarily
imply a memory leak. The problem can be as simple as a configuration
issue, where the specified heap size (or the default size, if it is not
specified) is insufficient for the application. The initial and maximum
size of the Java heap space can be configured using the –Xms and
–Xmx options.
In other cases, and in particular for a long-lived application, the message might indicate that the application is unintentionally holding references to objects, which prevents the objects from being garbage collected. This is the Java language equivalent of a memory leak.
Note: The APIs that are called by an application could also unintentionally be holding object references.
One other potential source of this error arises with applications that
make excessive use of finalizers. If a class has a finalize method,
then objects of that type do not have their space reclaimed at garbage
collection time. Instead, after garbage collection, the objects are
queued for finalization, which occurs at a later time. In the Oracle
implementations of the Java Runtime, finalizers are executed by a daemon
thread that services the finalization queue. If the thread cannot keep
up with the finalization queue, then the Java heap could fill up, and
this kind of java.lang.OutOfMemoryError error would be thrown. One
scenario that can cause this situation is when an application creates
high-priority threads that cause the finalization queue to increase at a
rate that is faster than the rate at which the finalizer thread is
servicing that queue.
Action: Try increasing the Java heap size. See Monitoring the Objects Pending Finalization to learn more about how to monitor objects for which finalization is pending. See Finalization and Weak, Soft, and Phantom References in Java Platform, Standard Edition HotSpot Virtual Machine Garbage Collection Tuning Guide for information about detecting and migrating from finalization.
1.2 Detail Message: GC Overhead limit exceeded
Cause: The detail message
GC overhead limit exceeded indicates that
the garbage collector (GC) is running most of the time, and the Java
application is making very slow progress. After a garbage collection, if
the Java application spends more than approximately 98% of its time
performing garbage collection and if it is recovering less than 2% of
the heap and has been doing so for the last five (compile-time constant)
consecutive garbage collections, then a java.lang.OutOfMemoryError
error is thrown. This error is typically thrown because the amount of
live data barely fits into the Java heap leaving little free space for
new allocations.
Action: Increase the heap size. The
java.lang.OutOfMemoryError error for GC Overhead
limit exceeded can be turned off using the command-line flag
-XX:-UseGCOverheadLimit
1.3 Detail Message: Requested array size exceeds VM limit
Cause: The detail message Requested array size exceeds VM limit indicates that the application (or APIs used by that application) attempted to allocate an array with a size larger than the VM implementation limit, irrespective of how much heap size is available.
Action: Ensure that your application (or APIs used by that application) allocates an array with a size less than the VM implementation limit.
1.4 Detail Message: Metaspace
Cause: Java class metadata (the virtual
machine’s internal presentation of a Java class) is allocated in native
memory (referred to here as Metaspace). If the Metaspace for class
metadata is exhausted, a java.lang.OutOfMemoryError error with a
detail message Metaspace is thrown. The amount
of Metaspace that can be used for class metadata is limited by the
parameter MaxMetaSpaceSize, which can be specified on the command
line. When the amount of native memory needed for class metadata exceeds
MaxMetaSpaceSize, a java.lang.OutOfMemoryError error with detail
message Metaspace is thrown.
Action: If MaxMetaSpaceSize has been
specified on the command-line, increase its value. Metaspace is
allocated from the same address space as the Java heap. Reducing the
size of the Java heap will make more space available for Metaspace. This
trade-off is only useful if there is an excess of free space in the Java
heap. See the following action for the Out of swap
space detail message.
1.5 Detail Message: request <SIZE> bytes for <REASON>. Out of swap space?
Cause: The detail message
request <SIZE> bytes for <REASON>. Out of
swap space? appears to be a java.lang.OutOfMemoryError error.
However, Java reports this apparent error when an allocation from the
native heap failed and the native heap might be close to exhaustion. The
message indicates the size (in bytes) of the request that failed and the
reason for the memory request. Usually the <REASON> is the name of
a source module reporting the allocation failure, although sometimes it
indicates the actual reason.
Action: When this error is thrown, the Java VM (JVM) invokes the fatal error handling mechanism: it generates a fatal error log file, which contains useful information about the thread, process, and system at the time of the crash. In the case of native heap exhaustion, the heap memory and memory map information in the log can be useful. See Fatal Error Log.
You might need to use troubleshooting utilities for the operating system to diagnose the issue further. See [Native Operating System Tools]( “Native Operating System Tools”).
1.6 Detail Message: Compressed class space
Cause: On 64-bit platforms, a pointer to
class metadata can be represented by 32-bit offset (with
UseCompressedOops). This is controlled by the command-line flag
UseCompressedClassPointers (true by default). If
UseCompressedClassPointers is true, the amount of space available
for class metadata is fixed at the amount CompressedClassSpaceSize. If
the space needed for UseCompressedClassPointers exceeds
CompressedClassSpaceSize, a java.lang.OutOfMemoryError error with
detail message Compressed class space is
thrown.
Action: Increase CompressedClassSpaceSize or set UseCompressedClassPointers to false.
Note: There are bounds on the acceptable size of CompressedClassSpaceSize.
For example -XX:CompressedClassSpaceSize=4g, exceeds acceptable bounds
and will result in a message such as
CompressedClassSpaceSize of 4294967296 is invalid; must be between 1048576 and 3221225472.
Note: There is more than one kind of class metadata: –klass metadata, and
other metadata. Only klass metadata is stored in the space bounded by
CompressedClassSpaceSize. Other metadata is stored in Metaspace.
1.7 Detail Message: <REASON> <STACK_TRACE> (Native method)
Cause: This detail message indicates that a native method has encountered an allocation failure. The difference between this and the previous message is that the allocation failure was detected in a Java Native Interface (JNI) or native method rather than in the JVM itself.
Action: If this type of
java.lang.OutOfMemoryError error is thrown, you might need to use
native utilities of the operating system to diagnose the issue further..
2 Detecting a Memory Leak
The java.lang.OutOfMemoryError error can be an indication of a memory
leak in a Java application. It might also indicate that either the Java
heap, Metaspace or the Compressed Class space is sized smaller than the
memory requirements of the application for that specific memory
pool.
Before assuming a memory leak in the application, ensure that the memory
pool for which you are seeing the java.lang.OutOfMemoryError error is
sized adequately. The Java heap can be sized using the –Xmx and –Xms
command-line options, and the maximum and initial size of Metaspace can
be configured using MaxMetaspaceSize and MetaspaceSize. Similarly,
the Compressed Class space can be sized using the
CompressedClassSpaceSize option.
Memory leaks are often very difficult to detect, especially those that
are slow. A memory leak occurs when an application unintentionally holds
references to Java objects or classes, preventing them from being
garbage collected. These unintentionally held objects or classes can
grow in memory over time, eventually filling up the entire Java heap or
Metaspace, causing frequent garbage collections and eventual process
termination with a java.lang.OutOfMemoryError error.
For detecting memory leaks, it is important to monitor the live set of the application that is, the amount of Java heap space or Metaspace being used after a full garbage collection. If the live set increases over time after the application has reached a stable state and is under a stable load, that could be a strong indication of a memory leak. The live set and memory usage of an application can be monitored by using JConsole and JDK Mission Control. The memory usage information can also be extracted from garbage collection logs.
Note that if the detail message of the error suggests the exhaustion of
the native heap, the application could be encountering a native memory
leak. To confirm native memory leaks, use native tools such as pmap or
PerfMon, and compare their periodically-collected output to determine
the newly-allocated or growing memory sections of the process.
2.1 JConsole
JConsole is a great tool for monitoring resources of Java applications. Among other things, it is helpful in monitoring the usage of various memory pools of an application, including generations of Java heap, Metaspace, Compressed Class Space, and CodeHeap.
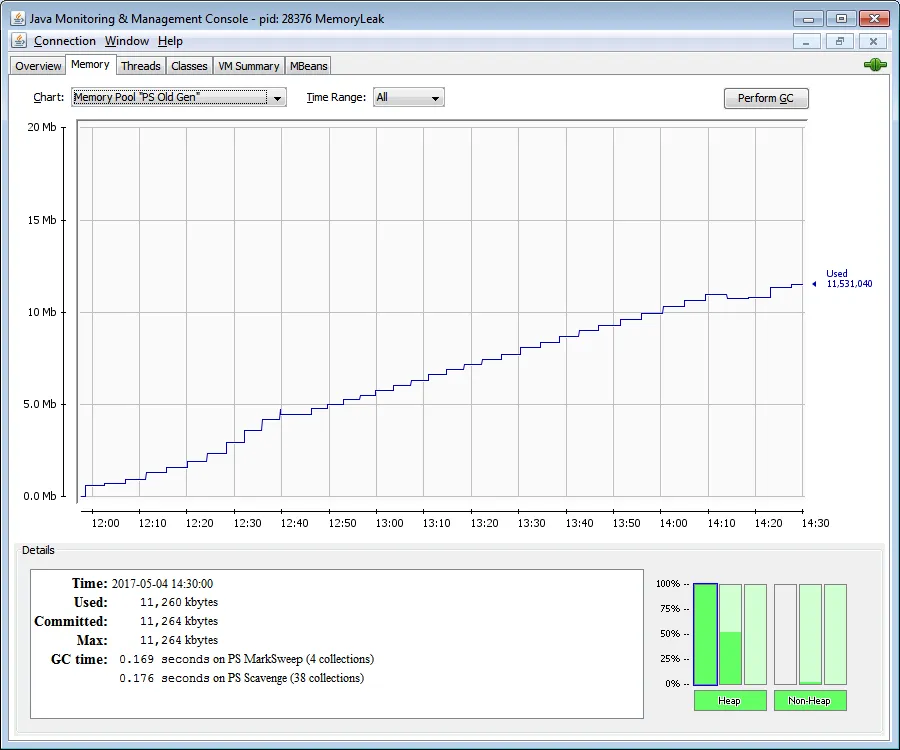
In the following screenshots, for an example program, the JConsole shows the usage of Heap Memory and Old Generation steadily increasing over a period of time. This steady growth in memory usage even after several full garbage collections indicates a memory leak.
Figure 1 JConsole Heap Memory
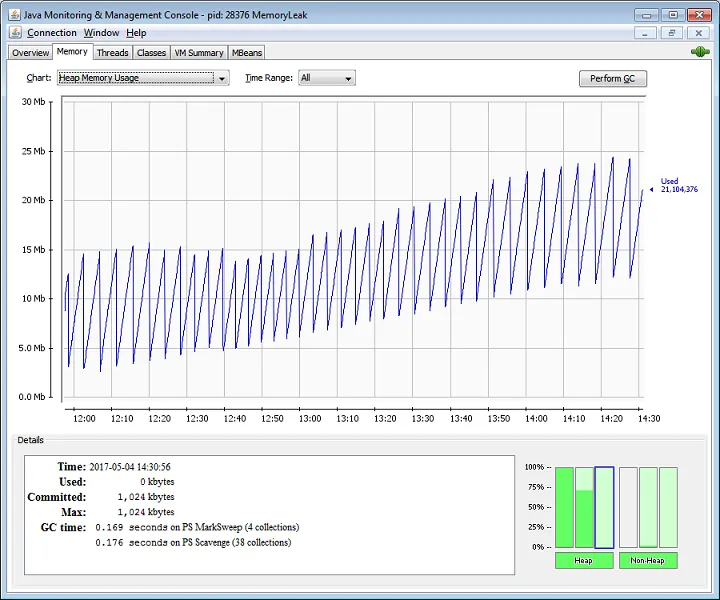
Figure 2 JConsole Old Generation
2.2 JDK Mission Control
You can detect memory leaks early and prevent
java.lang.OutOfMemoryError errors using JDK Mission Control (JMC).
Detecting a slow memory leak can be difficult. A typical symptom could
be the application becoming slower after running for a long time due to
frequent garbage collections. Eventually, java.lang.OutOfMemoryError
errors may be seen. However, memory leaks can be detected early, even
before such problems occur, by analyzing Java Flight recordings.
Watch if the live set of your application is increasing over time. The
live set is the amount of Java heap being used after a full garbage
collection, which collects all the unreachable objects. To inspect the
live set, start JMC and connect to a JVM using the Java Management
console (JMX). Open the MBean Browser tab and look for the GarbageCollectorAggregator MBean
under com.sun.management.
Start JMC and start a Time fixed recording (profiling recording) for an hour. Before starting a flight recording, make sure that the option Object Types + Allocation Stack Traces + Path to GC Root is selected from the Memory Leak Detectionsetting.
Once the recording is complete, the recording file (.jfr) opens in
JMC. Look at the Automated Analysis Results
page. To detect a memory leak focus on the Live
Objects section of the page. Here is an example of a recording,
which shows a heap size issue.
Figure 3 Memory Leak - Automated Analysis Page
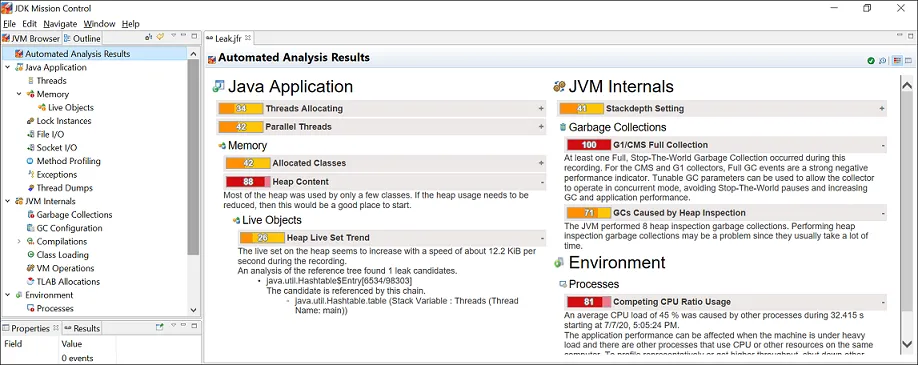
You can observe that in the Heap Live Set Trend section, the live set on the heap seems to increase rapidly and the analysis of the reference tree detected a leak candidate.
For further analysis, open the Java Applications page and then click the Memory page. Here is a sample figure of a recording, which shows memory leak issue.
Figure 4 Memory Leak - Memory Page
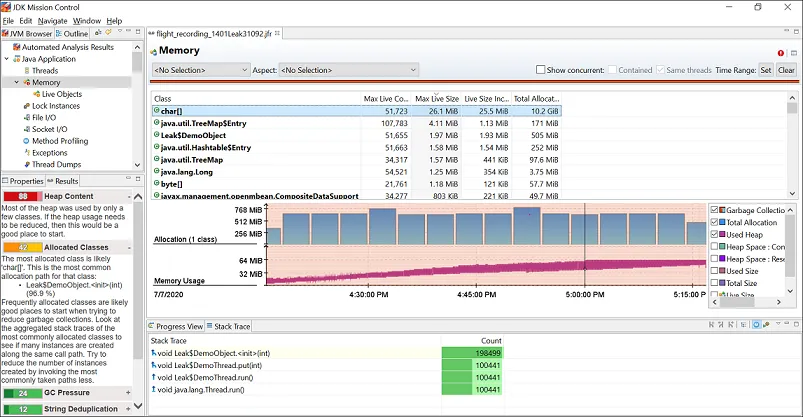
You can observe from the graph that the memory usage has increased steadily, which indicates a memory leak issue.
2.3 Garbage Collection Logs
Memory usage information can be extracted using GC logs as well. If the GC logs show that the application has performed several full garbage collections attempting to reclaim space in Old generation or Metaspace, but without any significant gain, this indicates that the application might be suffering from a memory leak problem.
GC logs can be collected using the –Xlog command-line Java option. An
example is given below: -Xlog:gc*,gc+phases=debug:gc.log
This will log messages tagged with at least gc using info level, and
messages tagged with exactly gc and phases tags using debug level
to a file called gc.log.
Here’s an excerpt from a GC log, collected with -Xlog:gc*.
[4.344s][info][gc,start       ] GC(46) Pause Full (Ergonomics)
        [4.344s][info][gc,phases,start] GC(46) Marking Phase
        [4.402s][info][gc,phases      ] GC(46) Marking Phase 57.896ms
        [4.402s][info][gc,phases,start] GC(46) Summary Phase
        [4.402s][info][gc,phases      ] GC(46) Summary Phase 0.023ms
        [4.402s][info][gc,phases,start] GC(46) Adjust Roots
        [4.402s][info][gc,phases      ] GC(46) Adjust Roots 0.108ms
        [4.402s][info][gc,phases,start] GC(46) Compaction Phase
        [4.435s][info][gc,phases      ] GC(46) Compaction Phase 33.721ms
        [4.436s][info][gc,phases,start] GC(46) Post Compact
        [4.436s][info][gc,phases      ] GC(46) Post Compact 0.073ms
        [4.436s][info][gc,heap        ] GC(46) PSYoungGen: 12799K(14848K)->12799(14848K) Eden: 12799K(12800K)->12799K(12800K) From: 0K(2048K)->0K(2048K)
        [4.436s][info][gc,heap        ] GC(46) ParOldGen: 34072K(34304K)->34072K(34304K)
        [4.436s][info][gc,metaspace   ] GC(46) Metaspace: 149K(384K)->149K(384K) NonClass: 145K(256K)->145K(256K) Class: 3K(128K)->3K(128K)
        [4.436s][info][gc             ] GC(46) Pause Full (Ergonomics) 45M->45M(48M) 92.086ms
        [4.436s][info][gc,cpu         ] GC(46) User=0.15s Sys=0.01s Real=0.10s
In this example, the Java heap is sized at 48M, and the Full GC was not able to reclaim any space. It is clear that the Old generation is completely full, and the Full GC could not help much. This suggests that either the heap is sized smaller than the application’s heap requirements, or there is a memory leak.
3 Diagnosing Java Memory Leaks
Diagnosing leaks in Java source code can be difficult. Usually, it requires very detailed knowledge of the application. In addition, the process is often iterative and lengthy. This section provides information about the tools that you can use to diagnose memory leaks in Java source code.
3.1 Diagnostic Data
This section looks at the diagnostic data you can use to troubleshoot memory leaks.
3.1.1 Heap Histograms
You can try to quickly narrow down a memory leak by examining the heap histogram. You can get a heap histogram in several ways:
-
If the Java process is started with the
-XX:+PrintClassHistogramcommand-line option, then the Control+Break handler will produce a heap histogram. -
You can use the
jmaputility to get a heap histogram from a running process. It is recommended to use the latest utility,jcmd, instead ofjmaputility for enhanced diagnostics and reduced performance overhead. The command in the following example creates a heap histogram for a running process usingjcmdand results similar to the followingjmapcommand:jcmd <process id/main class> GC.class_histogram filename=Myheaphistogram jmap -histo <PID> -
The output shows the total size and instance count for each class type in the heap. If a sequence of histograms is obtained (for example, every two minutes), then you might be able to see a trend that can lead to further analysis.
-
You can use the
jhsdb jmaputility to get a heap histogram from a core file, as shown in the following example:jhsdb jmap --histo --exe <JDK_HOME> /bin/java --core <CORE_FILE> -
For example, if you specify the
-XX:+CrashOnOutOfMemoryErrorcommand-line option while running your application, then when ajava.lang.OutOfMemoryErrorerror is thrown, the JVM will generate a core dump. You can then executejhsdb jmapon the core file to get a histogram, as shown in the following example.$ jhsdb jmap --histo --exe /usr/java/jdk-11/bin/java --core core.21844 Attaching to core core.21844 from executable /usr/java/jdk-11/bin/java, please wait... Debugger attached successfully. Server compiler detected. JVM version is 11-ea+24 Iterating over heap. This may take a while... Object Histogram: num #instances #bytes Class description -------------------------------------------------------------------------- 1: 2108 112576 byte[] 2: 546 66112 java.lang.Class 3: 1771 56672 java.util.HashMap$Node 4: 574 53288 java.lang.Object[] 5: 1860 44640 java.lang.String 6: 349 40016 java.util.HashMap$Node[] 7: 16 33920 char[] 8: 977 31264 java.util.concurrent.ConcurrentHashMap$Node 9: 327 15696 java.util.HashMap 10: 266 13800 java.lang.String[] 11: 485 12880 int[] : Total : 14253 633584 Heap traversal took 1.15 seconds.
The above example shows that the java.lang.OutOfMemoryError error was
caused by the number of byte arrays (2108 instances in the heap).
Without further analysis it is not clear where the byte arrays are
allocated. However, the information is still useful.
3.1.2 Heap Dumps
Heap dumps are the most important data to troubleshoot memory leaks.
Heap dumps can be collected using jcmd, jmap, JConsole tools, and
the -XX:+HeapDumpOnOutOfMemoryError Java option
- You can use the
GC.heap_dumpcommand with thejcmdutility to create a heap dump as shown below:jcmd <process id/main class> GC.heap_dump filename=heapdump.dmp jmapwith-dump:format=bcan dump heap from a running process:jmap -dump:format=b,file=snapshot.jmap <PROCESS_ID>- The MBean browser in JConsole makes the
HotSpotDiagnosticMBean available, and that can be used to create heap dumps for the attached Java process. - You can use the
-XX:+HeapDumpOnOutOfMemoryErrorJava option to dump the Java heap of a process when it fails with ajava.lang.OutOfMemoryErrorerror.
3.1.3 Java Flight Recordings
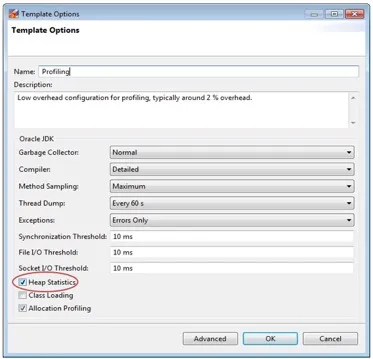
Flight Recordings collected with heap statistics enabled can be helpful in troubleshooting a memory leak, showing you the Java objects and the top growers in the Java heap over time. To enable heap statistics, you can use JDK Mission Control (JMC) and enable the ‘Heap Statistics’ by going to ‘Window > Flight Recording Template Manager’ as shown below.
Figure 5 Flight Recording Template Manager
Heap Statistics can also be enabled by manually editing the .jfc file,
and setting heap-statistics-enabled to true.
    <event path="vm/gc/detailed/object_count">
              <setting name="enabled" control="heap-statistics-enabled">true</setting>
              <setting name="period">everyChunk</setting>
          </event>
The flight recordings can then be created using any of the following ways:
- Java Flight Recorder options:
-XX:StartFlightRecording=delay=20s,duration=60s,name=MyRecording,filename=myrecording.jfr,settings=profile - JMC
3.1.4 Class Loader Statistics
Information about class loaders and the number of classes loaded by them can be very helpful in diagnosing memory leaks related to Metaspace and Compressed Class Space.
The class loader statistics information can be collected using jcmd
and jmap tools, as shown in the examples below:
jcmd <process id/main name> VM.classloader_stats

jmap –clstats <process id>
The following is an example of output generated by jmap.
jmap -clstats 15557
      ClassLoader         Parent              CLD*               Classes   ChunkSz   BlockSz  Type
      0x0000000800c40ac8  0x0000000800085938  0x00007ff3a18787e0       1       768       184  java.net.URLClassLoader
      0x0000000800c40ac8  0x0000000800085938  0x00007ff39f652f90       1       768       184  java.net.URLClassLoader
      0x0000000800c40ac8  0x0000000800085938  0x00007ff39f499620       1       768       184  java.net.URLClassLoader
      0x0000000800c40ac8  0x0000000800085938  0x00007ff3a194e3a0       1       768       184  java.net.URLClassLoader
      0x0000000800c40ac8  0x0000000800085938  0x00007ff39f5aaad0       1       768       184  java.net.URLClassLoader
      0x0000000800c40ac8  0x0000000800085938  0x00007ff3a1823d20       1       768       184  java.net.URLClassLoader
      0x0000000800c40ac8  0x0000000800085938  0x00007ff3a194cab0       1       768       184  java.net.URLClassLoader
      0x0000000800c40ac8  0x0000000800085938  0x00007ff3a1883190       1       768       184  java.net.URLClassLoader
      0x0000000800c40ac8  0x0000000800085938  0x00007ff3a191b9c0       1       768       184  java.net.URLClassLoader
      0x0000000800c40ac8  0x0000000800085938  0x00007ff3a1914810       1       768       184  java.net.URLClassLoader
      0x0000000800c40ac8  0x0000000800085938  0x00007ff3a181c050       1       768       184  java.net.URLClassLoader
      0x0000000800c40ac8  0x0000000800085938  0x00007ff39f5c57c0       1       768       184  java.net.URLClassLoader
      0x0000000800c40ac8  0x0000000800085938  0x00007ff39f6774d0       1       768       184  java.net.URLClassLoader
      0x0000000800c40ac8  0x0000000800085938  0x00007ff3a18574b0       1       768       184  java.net.URLClassLoader
      0x0000000800c40ac8  0x0000000800085938  0x00007ff3a1803500       1       768       184  java.net.URLClassLoader
      …
      Total = 1105                                        1757   1404032    308858
      ChunkSz: Total size of all allocated metaspace chunks
      BlockSz: Total size of all allocated metaspace blocks (each chunk has several blocks)
3.2 Analysis Tools
This section explores the analysis tools you can use to diagnose memory leaks, including those that can analyze diagnostic data described above.
3.2.1 Heap Dump Analysis Tools
There are many third-party tools available for heap dump analysis. The Eclipse Memory Analyzer Tool (MAT) and YourKit are two examples of commercial tools with memory debugging capabilities. There are many others, and no specific product is recommended.
3.2.2 JDK Mission Control (JMC)
The Flight Recorder records detailed information about the Java runtime and Java applications running on the Java runtime.
This section describes how to debug a memory leak by analyzing a flight recording in JMC.
You can use the Java Flight Recordings to identify the leaking objects. To find the leaking class, open the Memory page and click the Live Objects page. Here is a sample figure of a recording, which shows the leaking class.
Figure 6 Memory Leak - Live Objects Page
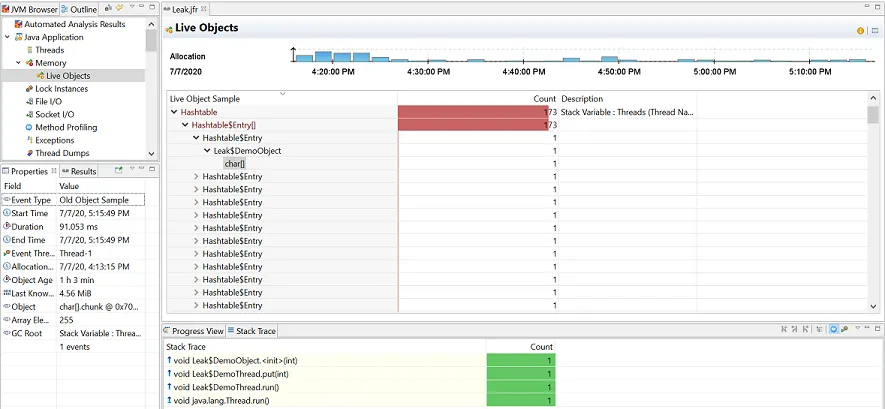
You can observe that most of the live objects being tracked are held by
Leak$DemoThread, which in turn holds a leaked char[] class. For
further analysis, see the Old Object Sample event in the
Results tab that contains sampling
of the objects that have survived. This event contains the time of
allocation, the allocation stack trace, and the path back to the GC
root.
When a potentially leaking class is identified, look at the TLAB Allocations page in the JVM Internals page for some samples of where objects were allocated. Here is a sample recording, showing TLAB allocations.
Figure 7 Memory Leak - TLAB Allocations
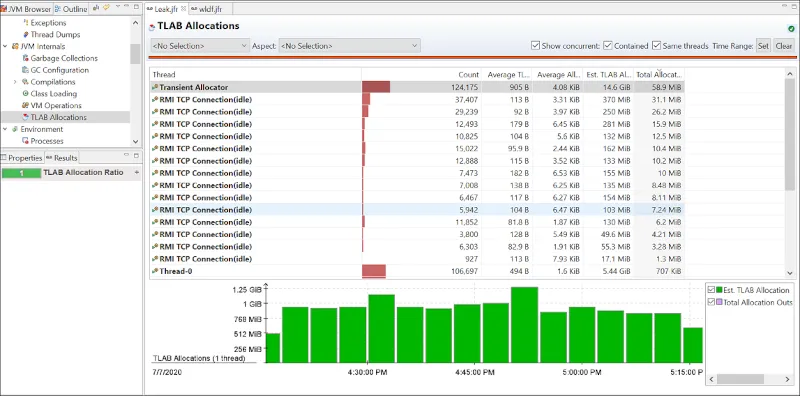
Check the class samples being allocated. If the leak is slow, there may be a few allocations of this object and may be no samples. Also, it may be that only a specific allocation site is leading to a leak. You can make required changes to the code to fix the leaking class.
3.2.3 The jfr tool
Java Flight Recorder (JFR) records detailed information about the Java runtime and the Java application running on the Java runtime. This information can be used to identify memory leaks.
To detect a memory leak, JFR must be running at the time that the leak occurs. The overhead of JFR is very low, less than 1%, and it has been designed to be safe to have always on in production.
Start a recording when the application is started using the java
command as shown in the following example:
$ java -XX:StartFlightRecordingWhen the JVM runs out of memory and exits due to a
java.lang.OutOfMemoryError error, a recording with the prefix
hs_oom_pid is often, but not always, written to the directory in which
the JVM was started. An alternative way to get a recording is to dump it
before the application runs out of memory using the jcmd tool, as
shown in the following example:
$ jcmd <PID> JFR.dump filename=recording.jfr path-to-gc-roots=trueWhen you have a recording, use the jfr tool located in the
<JDK_HOME>/bin directory to print Old Object Sample events that
contain information about potential memory leaks. The following example
shows the command and an example of the output from a recording for an
application with the pid 16276:
jfr print --events OldObjectSample pid16276.jfr
      ...

      jdk.OldObjectSample {
        startTime = 18:32:52.192
        duration = 5.317 s
        allocationTime = 18:31:38.213
        objectAge = 74.0 s
        lastKnownHeapUsage = 63.9 MB
        object =  [
          java.util.HashMap$Node
          [15052855] : java.util.HashMap$Node[33554432]
          table : java.util.HashMap Size: 15000000
          map : java.util.HashSet
          users : java.lang.Class Class Name: Application
        ]
        arrayElements = N/A
        root = {
          description = "Thread Name: main"
          system = "Threads"
          type = "Stack Variable"
        }
        eventThread = "main" (javaThreadId = 1)
      }

      ...

      jdk.OldObjectSample {
        startTime = 18:32:52.192
        duration = 5.317 s
        allocationTime = 18:31:38.266
        objectAge = 74.0 s
        lastKnownHeapUsage = 84.4 MB
        object =  [
          java.util.HashMap$Node
          [8776975] : java.util.HashMap$Node[33554432]
          table : java.util.HashMap Size: 15000000
          map : java.util.HashSet
          users : java.lang.Class Class Name: Application
        ]
        arrayElements = N/A
        root = {
          description = "Thread Name: main"
          system = "Threads"
          type = "Stack Variable"
        }
        eventThread = "main" (javaThreadId = 1)
      }

      ...

      jdk.OldObjectSample {
        startTime = 18:32:52.192
        duration = 5.317 s
        allocationTime = 18:31:38.540
        objectAge = 73.7 s
        lastKnownHeapUsage = 121.7 MB
        object =  [
          java.util.HashMap$Node
          [393162] : java.util.HashMap$Node[33554432]
          table : java.util.HashMap Size: 15000000
          map : java.util.HashSet
          users : java.lang.Class Class Name: Application
        ]
        arrayElements = N/A
        root = {
          description = "Thread Name: main"
          system = "Threads"
          type = "Stack Variable"
        }
        eventThread = "main" (javaThreadId = 1)
      }

      ...
To identify a possible memory leak, review the following elements in the recording:
- First, notice that the
lastKnownHeapUsageelement in the Old Object Sample events is increasing over time, from 63.9 MB in the first event in the example to 121.7 MB in the last event. This increase is an indication that there is a memory leak. Most applications allocate objects during startup and then allocate temporary objects that are periodically garbage collected. Objects that are not garbage collected, for whatever reason, accumulate over time and increase the value oflastKnownHeapUsage. - Next, look at the
allocationTimeelement to see when the object was allocated. Objects that are allocated during startup are typically not memory leaks, neither are objects allocated close to when the dump was taken. TheobjectAgeelement shows how long the object has been alive. ThestartTimeanddurationelements are not related to when the memory leak occurred, but when theOldObjectevent was emitted and how long it took to gather data for it. This information can be ignored. - Then look at the
objectelement to see the memory leak candidate; in this example, an object of typejava.util.HashMap$Node. It is held by thetablefield in thejava.util.HashMapclass, which is held byjava.util.HashSet, which in turn is held by theusersfield of theApplicationclass. - The
rootelement contains information about the GC root. In this example, theApplicationclass is held by a stack variable in the main thread. TheeventThreadelement provides information about the thread that allocated the object.
If the application is started with the
-XX:StartFlightRecording:settings=profile option, then the recording
also contains the stack trace from where the object was allocated, as
shown in the following example:
stackTrace = [
          java.util.HashMap.newNode(int, Object, Object, HashMap$Node) line: 1885
          java.util.HashMap.putVal(int, Object, Object, boolean, boolean) line: 631
          java.util.HashMap.put(Object, Object) line: 612
          java.util.HashSet.add(Object) line: 220
          Application.storeUser(String, String) line: 53
          Application.validate(String, String) line: 48
          Application.login(String, String) line: 44
          Application.main(String[]) line: 30
        ]
In this example we can see that the object was put in the HashSet when
the storeUser(String, String) method was called. This suggests that
the cause of the memory leak might be objects that were not removed from
the HashSet when the user logged out.
It is not recommended to always run all applications with the
-XX:StartFlightRecording:settings=profile option due to overhead in
certain allocation-intensive applications, but is typically OK when
debugging. Overhead is usually less than 2%.
Setting path-to-gc-roots=true creates overhead, similar to a full
garbage collection, but also provides reference chains back to the GC
root, which is usually sufficient information to find the cause of a
memory leak.
3.2.4 NetBeans Profiler
The NetBeans Profiler can locate memory leaks very quickly. Commercial memory leak debugging tools can take a long time to locate a leak in a large application. The NetBeans Profiler, however, uses the pattern of memory allocations and reclamations that such objects typically demonstrate. This process includes also the lack of memory reclamations. The profiler can check where these objects were allocated, which often is sufficient to identify the root cause of the leak. See Introduction to Profiling Java Applications in NetBeans IDE.
4 Diagnosing Native Memory Leaks
Several techniques can be used to find and isolate native code memory leaks. In general, there is no ideal solution for all platforms.
The following are some techniques to diagnose leaks in native code.
4.1 Tracking All Memory Allocation and Free Calls
A very common practice is to track all allocation and free calls of native allocations. This can be a fairly simple process or a very sophisticated one. Many products over the years have been built up around the tracking of native heap allocations and the use of that memory.
Tools such as IBM Rational Purify can be used to find these leaks in normal native code situations and also find any access to native heap memory that represents assignments to uninitialized memory or accesses to freed memory.
Not all these types of tools will work with Java applications that use native code, and usually these tools are platform-specific. Because the JVM dynamically creates code at runtime, these tools can incorrectly interpret the code and fail to run at all, or give false information. Check with your tool vendor to ensure that the version of the tool works with the version of the JVM you are using.
See SourceForge for many simple and portable native memory leak detecting examples. Most libraries and tools assume that you can recompile or edit the source of the application and place wrapper functions over the allocation functions. The more powerful of these tools allow you to run your application unchanged by interposing over these allocation functions dynamically.
Native memory leaks can result from native allocations performed either internally by the JVM, or from outside the JVM. The following two sections discuss in detail how both of these memory leaks can be diagnosed.
4.1.1 Native Memory Leaks for Allocations performed by the JVM
The JVM has a powerful tool called Native Memory Tracking (NMT) that tracks native memory allocations performed internally by the JVM. Note that this tool cannot track native memory allocated outside of the JVM, for example by JNI code.
Here is how this tool can be used:
- Enable NMT in the process that you want to monitor by using the Java
option
NativeMemoryTracking. The output level of the tracking can be set to asummaryordetaillevel as shown below:-XX:NativeMemoryTracking=summary -XX:NativeMemoryTracking=detail - The
jcmdtool can then be used to attach to the NMT-enabled process, and obtain its native memory usage details. It is also possible to collect a baseline of memory usage and then collect the difference in usage against that baseline.jcmd <process id/main class> VM.native_memory jcmd <process id/main class> VM.native_memory baseline jcmd <process id/main class> VM.native_memory detail.diff/summary.diff
Note: Enabling NMT can result in a performance drop of around 5 to 10 percent. Therefore, it should be enabled in production systems cautiously. Additionally, the native memory used by NMT is tracked by the tool itself.
In the following example, the JConsole screenshot shows that the usage of ‘Compressed Class Space’ is growing at a constant rate over time.
Figure 8 JConsole Compressed Class Space
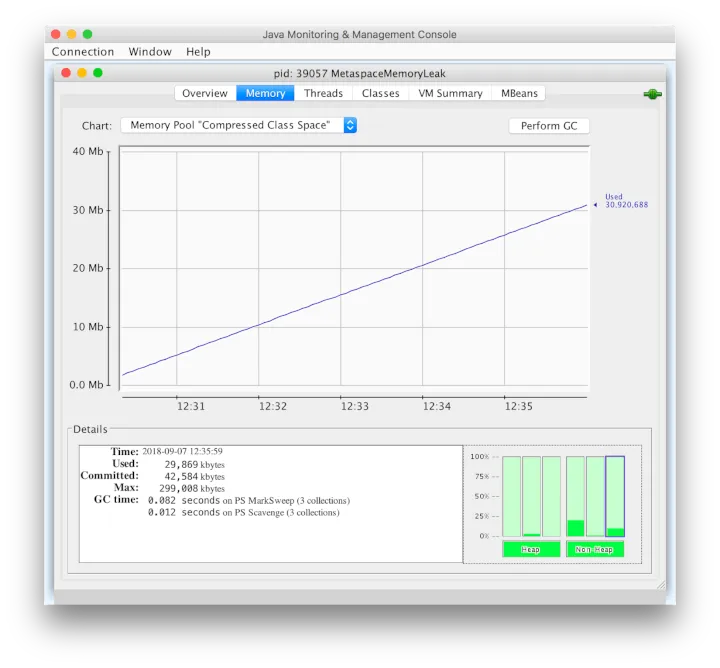
To diagnose this usage growth, the Java process can be tracked using the
NMT. Collecting a baseline and a summary.diff output shows that the
class space usage is increasing dramatically due to the corresponding
increase in the number of loaded classes.
bash-3.2$ jcmd 39057 VM.native_memory summary.diff
      39057:
      Native Memory Tracking:
      Total: reserved=5761678KB +52943KB, committed=472350KB +104143KB
      -           Java Heap (reserved=4194304KB, committed=163328KB +7680KB)
                                  (mmap: reserved=4194304KB, committed=163328KB +7680KB)

      -              Class (reserved=1118333KB +47579KB, committed=117949KB +89963KB)
                        (classes #68532 +58527)
                        (malloc=8317KB +2523KB #5461 +3371)
                        (mmap: reserved=1110016KB +45056KB, committed=109632KB +87440KB)

      -              Thread (reserved=21594KB -2057KB, committed=21594KB -2057KB)
                         (thread #22 -2)
                         (stack: reserved=21504KB -2048KB, committed=21504KB -2048KB)
                         (malloc=65KB -6KB #111 -10)
                         (arena=25KB -2 #42 -4)

      -              Code (reserved=250400KB +244KB, committed=5612KB +1348KB)
                         (malloc=800KB +244KB #1498 +234)
                         (mmap: reserved=249600KB, committed=4812KB +1104KB)

      -              GC (reserved=159039KB +18KB, committed=145859KB +50KB)
                         (malloc=5795KB +18KB #856 +590)
                         (mmap: reserved=153244KB, committed=140064KB +32KB)

      -              Compiler (reserved=153KB, committed=153KB)
                         (malloc=22KB #72 -2)
                         (arena=131KB #3)

      -              Internal (reserved=13537KB +6949KB, committed=13537KB +6949KB)
                          (malloc=13505KB +6949KB #70630 +59119)
                          (mmap: reserved=32KB, committed=32KB)

      -              Symbol (reserved=2715KB +9KB, committed=2715KB +9KB)
                           (malloc=1461KB +9KB #702 +29)
                           (arena=1255KB #1)

      -       Native Memory Tracking (reserved=1416KB +1031KB, committed=1416KB +1031KB)
                            (malloc=140KB +34KB #2197 +518)
                            (tracking overhead=1275KB +997KB)

      -               Arena Chunk (reserved=186KB -832KB, committed=186KB -832KB)
                                  (malloc=186KB -832KB)
4.1.2 Native Memory Leaks from Outside the JVM
For native memory leaks originating outside the JVM, you can use platform-native or other third-party tools for their detection and troubleshooting. Here is a list of some of the tools that you can find useful in troubleshooting native memory leaks caused by allocations performed outside the JVM.
- Valgrind
- Purify, available on both UNIX platforms and Windows
- Using Crash Dump or Core files
- On Windows, search Microsoft Docs for debug support. The Microsoft C++ compiler has the
/Mdand/Mddcompiler options that will automatically include extra support for tracking memory allocation. User-Mode Dump Heap (UMDH) is also helpful in tracking memory allocations. - Linux systems have tools such as
mtraceandlibnjamdto help in dealing with allocation tracking.
The following section takes a closer look at two of these tools.
4.1.2.1 Valgrind
Valgrind can be used to diagnose native memory leaks on Linux. To monitor a Java process using Valgrind, it can be launched as follows:
$ valgrind --leak-check=full --show-leak-kinds=all --suppressions=suppression_file --log-file=valgrind_with_suppression.log -v java <Java Class>A suppression file can be supplied to valgrind with --log-file option
in order for it to not consider the JVM internal allocations (such as
the Java heap allocation) as potential memory leaks, otherwise it
becomes very difficult to parse through the verbose output and manually
look for relevant leak reports.
The following are the contents of a sample suppression file:
{
         name
         Memcheck:Leak
         fun:*alloc
         ...
         obj:/opt/java/jdk16/jre/lib/amd64/server/libjvm.so
         ...
      }
With the above command, and with suppressions in place, Valgrind writes the identified leaks in the specified log file. An example is shown below:
==5200== 88 bytes in 1 blocks are still reachable in loss record 461 of 18,861
      ==5200==    at 0x4C2FB55: calloc (in /usr/lib/valgrind/vgpreload_memcheck-amd64-linux.so)
      ==5200==    by 0x7DCB156: Java_java_util_zip_Deflater_init (in /opt/jdk/ /jre/lib/amd64/libzip.so)
      ==5200==    by 0x80F54FC: ???
      ==5200==    by 0x8105F87: ???
      ==5200==    by 0xFFFFFFFE: ???
      ==5200==    by 0xEC67F74F: ???
      ==5200==    by 0xC241B03F: ???
      ==5200==    by 0xEC67D767: ???
      ==5200==    by 0x413F96F: ???
      ==5200==    by 0x8101E7B: ???
      ==5200==
      ==5200== 88 bytes in 1 blocks are still reachable in loss record 462 of 18,861
      ==5200==    at 0x4C2FB55: calloc (in /usr/lib/valgrind/vgpreload_memcheck-amd64-linux.so)
      ==5200==    by 0x7DCB156: Java_java_util_zip_Deflater_init (in /opt/jdk/jre/lib/amd64/libzip.so)
      ==5200==    by 0x80F54FC: ???
      ==5200==    by 0x8105F87: ???
      ==5200==    by 0xFFFFFFFE: ???
      ==5200==    by 0xEC67FF3F: ???
      ==5200==    by 0xC241B03F: ???
      ==5200==    by 0xEC630EB7: ???
      ==5200==    by 0x413F96F: ???
      ==5200==    by 0x8101E7B: ???
      ==5200==    by 0x41: ???
      ==5200==    by 0x19EAE47F: ???
In the above output, Valgrind correctly reports that there are
allocations leaking from Java_java_util_zip_Deflater_init
native method.
Note: Using Valgrind may have a negative impact on the performance of the monitored application.
4.1.2.2 Crash Dump or Core Files
On UNIX platforms, the pmap tool is helpful in identifying the memory
blocks that might be changing/growing in size over time. Once you have
identified the growing memory blocks or sections, you can examine the
corresponding crash dump or core file(s) to look at those memory blocks.
The values and contents at those locations can provide some valuable
clues, which can help tie them back to the source code responsible for
the allocations in those memory blocks.
$ diff pmap.15767.1 pmap.15767.3
      69,70c69,70
      < 00007f6d68000000 17036K rw--- [ anon ]
      < 00007f6d690a3000 4850K ----- [ anon ]
      ---
      > 00007f6d68000000 63816K rw--- [ anon ]
      > 00007f6d690a3000 65536K ----- [ anon ]
From the previous pmap output, we can see that the memory block at
00007f6d690a3000 is growing between the two memory snapshots of the
process. Using a core file collected from the process, we can examine
the contents of this memory block.
$ gdb `which java` core.15767
      GNU gdb (Ubuntu 7.11.1-0ubuntu1~16.5) 7.11.1
      Copyright (C) 2016 Free Software Foundation, Inc.
      ...
      (gdb) x/100s 0x00007f6d690a3000
      0x7f6d690a3000: "mory Leak "
      0x7f6d690a300c: "Alert: JNI Memory Leak "
      0x7f6d690a3025: "Alert: JNI Memory Leak "
      0x7f6d690a303e: "Alert: JNI Memory Leak "
      0x7f6d690a3057: "Alert: JNI Memory Leak "
      0x7f6d690a3070: "Alert: JNI Memory Leak "
The above shows that there is a repeating string, “Alert: JNI Memory Leak”, present in that memory block. Searching in the source code for the string or contents found in the relevant memory block can lead us to the culprit in the code. Here is the code used for this example, where these allocations are performed in JNI code and are not being released.
JNIEXPORT void JNICALL Java_JNINativeLeak_allocateMemory
      (JNIEnv *env, jobject obj, jint size) {
          char* bytes = (char*) malloc(size);
          printf("Allocated %d bytes at %p \n", size, (void*)bytes);
          for (int i=0; i<40; i++) {
              strcpy(bytes+i*25, "Alert: JNI Memory Leak ");
          }
      }
Hence, the pmap tool and core files can help in getting to the root of
native memory leaks caused by allocations performed outside of the JVM.
4.2 Tracking All Memory Allocations in the JNI Library
If you write a JNI library, then consider creating a localized way to ensure that your library does not leak memory, by using a simple wrapper approach.
The procedure in the following example is an easy localized allocation tracking approach for a JNI library. First, define the following lines in all source files.
#include <stdlib.h>
      #define malloc(n) debug_malloc(n, __FILE__, __LINE__)
      #define free(p) debug_free(p, __FILE__, __LINE__)
Then, you can use the functions in the following example to watch for leaks.
/* Total bytes allocated */
      static int total_allocated;
      /* Memory alignment is important */
      typedef union { double d; struct {size_t n; char *file; int line;} s; } Site;
      void *
      debug_malloc(size_t n, char *file, int line)
      {
          char *rp;
          rp = (char*)malloc(sizeof(Site)+n);
          total_allocated += n;
          ((Site*)rp)->s.n = n;
          ((Site*)rp)->s.file = file;
          ((Site*)rp)->s.line = line;
          return (void*)(rp + sizeof(Site));
      }
      void
      debug_free(void *p, char *file, int line)
      {
          char *rp;
          rp = ((char*)p) - sizeof(Site);
          total_allocated -= ((Site*)rp)->s.n;
          free(rp);
      }
The JNI library would then need to periodically (or at shutdown) check
the value of the total_allocated variable to verify that it made
sense. The preceding code could also be expanded to save in a linked
list the allocations that remained, and report where the leaked memory
was allocated. This is a localized and portable way to track memory
allocations in a single set of sources. You would need to ensure that
debug_free() was called only with the pointer that came from debug_malloc(), and you would also need to create
similar functions for realloc(), calloc(), strdup(), and so forth, if they were used.
A more global way to look for native heap memory leaks involves interposition of the library calls for the entire process.
5 Monitoring the Objects Pending Finalization
Different commands and options are available to monitor objects pending finalization.
When the java.lang.OutOfMemoryError error is thrown with the
Java heap space detail message, the cause
can be the excessive use of finalizers. To diagnose this, you have
several options for monitoring the number of objects that are pending
finalization:
- The
JConsolemanagement tool can be used to monitor the number of objects that are pending finalization. This tool reports the pending finalization count in the memory statistics on the Summary tab pane. The count is approximate, but it can be used to characterize an application and understand if it relies heavily on finalization. - On Linux, the
jmaputility can be used with the-finalizerinfooption to print information about objects awaiting finalization. - An application can report the approximate number of objects pending
finalization using the
getObjectPendingFinalizationCountmethod of thejava.lang.management.MemoryMXBeanclass. Links to the API documentation and example code can be found in Custom Diagnostic Tools. The example code can easily be extended to include the reporting of the pending finalization count.
See Finalization and Weak, Soft, and Phantom References in Java Platform, Standard Edition HotSpot Virtual Machine Garbage Collection Tuning Guide for information about detecting and migrating from finalization.
6 Troubleshooting a Crash Instead of a java.lang.OutOfMemoryError error
Use the information in the fatal error log or the crash dump to troubleshoot a crash.
Sometimes an application crashes soon after an allocation from the native heap fails. This occurs with native code that does not check for errors returned by the memory allocation functions.
For example, the malloc system call returns null if there is no
memory available. If the return from malloc is not checked, then the
application might crash when it attempts to access an invalid memory
location. Depending on the circumstances, this type of issue can be
difficult to locate.
However, sometimes the information from the fatal error log or the crash dump is sufficient to diagnose this issue. The fatal error log is covered in detail in Fatal Error Log. If the cause of the crash is an allocation failure, then determine the reason for the allocation failure. As with any other native heap issue, the system might be configured with an insufficient amount of swap space, another process on the system might be consuming all memory resources, or there might be a leak in the application (or in the APIs that it calls) that causes the system to run out of memory.
Last reviewed on Sat Feb 01 2025 00:00:00 GMT+0000 (Coordinated Universal Time)