Understanding the Java Heap versus the Native (C) Heap
Applies To
Java SE JDK and JRE - Version 8 and later
Any platform
Introduction to Heap Spaces
A Java process consists of two separate heap spaces:
- Java heap
- Native heap, also known as “C heap”
This can be confusing when it comes to understanding OutOfMemoryErrors and memory allocation failures. This document explains some differences between these memory spaces and how to handle various OutOfMemoryErrors related to the C heap and Java heap.
Memory Pools and Consumers of Virtual Process Memory
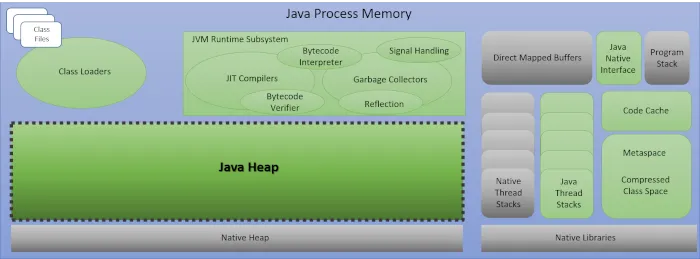
When you look at a Java process, there are many memory pools and consumers of the virtual process memory: Java heap and C heap are just two. Others include the Java Virtual Machine’s (JVM’s) Metaspace, and Codecache, as well as thread stacks, program stack, libraries, and others, as shown in the following diagram:
It is important to understand that Java heap and C heap are separate memory pools within the process memory:
- The Java heap is a memory pool used to store all the Java objects allocated by Java code.
- The C heap is used to store all the native objects allocated by native code. The Hotspot JVM is essentially a C++ application, and as such, the JVM allocates C++ objects on the C heap to perform its work. Java applications may also have native components that allocate native objects on the C heap.
Java objects are never stored in the C heap and native objects are never stored in the Java heap.
Both the Java heap and the C heap require contiguous virtual process memory, also called address space (addressable memory space). However, the sizes of the Java heap and C heap are usually very different. Also, the size of the Java heap can be configured explicitly through java command arguments, but the C heap size is not configurable. C heap simply expands as needed within the address space. Additionally, while the Java garbage collector manages the Java heap and clears objects that are no longer referenced, the C heap is not managed. Memory allocated in C heap must be freed explicitly when it is no longer needed.
A process memory map (pmap) shows the address space layout of the entire process. Within the pmap, the C heap is labeled as heap and the Java heap is mapped in as anonymous memory, so it is labeled anon. Here, we can see two entries of a 64-bit pmap:
    0000000100400000   757760    757760    757760   - rwx----   [ heap ]
    00000006C0800000  4194304   2781184   2777088   - rw-----   [ anon ]
Notice the C heap starts at a very low address and the Java heap starts at an address that is 23Gb higher in the address space (Hex: 6C0800000 - 100400000 = Dec: 23Gb). This allows the C heap to grow on demand as the application runs. Other allocations may also get mapped between them, such as thread stacks, byte buffers, and the like.
Native OutOfMemoryErrors
Native OutOfMemoryErrors can occur when the C heap can no longer grow as needed within its address space. Even when you have plenty of unused physical and swap file memory, if you’re short on virtual address space, you may receive an OutOfMemoryError. The following errors can occur particularly when the C heap has no more room to grow contiguously or an allocation fails due to lack of available address space.
java.lang.OutOfMemoryError: requested 67108872 bytes for Chunk::new. Out of swap space?

    # There is insufficient memory for the Java Runtime Environment to continue. # Native memory allocation (malloc) failed to allocate 65544 bytes
(This error can also mean the system is out of physical memory.)
32-Bit Applications
A classic example of this occurs with 32-bit Java applications, where the 32-bit process size is limited to 4Gb. This means all of the memory consumers in the diagram above, plus operating system kernel reservations, must fit within the 4Gb limit. If the Java heap is sized too large, there may not be enough room for the C heap to grow when needed. Consider a 32-bit application that runs well when the Java heap is sized at 2Gb. Over time, load increases on this application now require you to increase the Java heap size to 3Gb. However, after some days of runtime, you start getting errors like the one above.
What happened? Before the Java heap size increase, the C heap could easily have been allowed a 1Gb space ( [4Gb process size] - [2Gb Java heap] - [1Gb C heap] = [1Gb left for everything else] ), which is plenty (let us say). After the increase, 4Gb address space minus 3Gb Java heap leaves just 1Gb for the C heap plus all other memory pools/consumers. So when the thread stacks, Codecache, program stack, Metaspace, etcetera, get allocated, this leaves less space for the C heap. When the JVM attempts a native object allocation and there is no room for the C heap to expand further, a native OutOfMemoryError occurs.
So with 32-bit applications, care must be taken to size the Java heap such that all other process memory consumers get the portion of address space they need. If you crash with a native OutOfMemoryError, do the following:
- Verify that the HotSpot Fatal Error Log,
hs_err_pid*.log(instructions on how to locate and interpret it) shows plenty of available physical memory and swap file space at the time of the crash, such as the following entry:Memory: 4k page, physical 2117891368k(993816496k free), swap 100990972k(100990972k free)If you are out of physical or swap memory, reduce the memory load on the system or increase system or swap memory, as appropriate. Note: Reducing the memory load may include decreasing the Java heap size(s) for the Java process or processes, as well as reducing the number of processes and threads running on the system. - If the OutOfMemoryError is specific to the one process and not a
system memory issue, pull a pmap from the process core file
(
pmap <COREFILE>) to verify if the address space had been full or if the C heap did not have room to grow any further when the crash occurred. If the OutOfMemoryError was due to a lack of address space or C heap, then decreasing the Java heap size to make more room in the address space for the C heap or other native memory allocations may be a solution. Note: Decreasing the size of thread stacks or the sizes of other process memory pools may also be an option. - Verify if the OutOfMemoryError still occurs. If so, investigate whether you have a native memory leak. See Diagnosing Native Memory Leaks for more information. That document details how to use Native Memory Tracking to determine if the native memory growth occurs with the JVM’s native memory allocations, and for native memory leaks outside the JVM’s allocations, it details which Linux and Windows tools you can use to debug on those platforms.
- Move the application to a 64-bit JVM and 64-bit operating system when the application has outgrown the 32-bit address space limitation. In this case, there is no memory leak and the size of the Java heap and JVM’s other memory pools cannot be reduced.
64-Bit Applications
With 64-bit applications, running out of address space is usually not a
problem, but if the Java heap is based too low in the address space, the
C heap may run out of room to grow. This can occur more often when
CompressedOops is enabled and the maximum Java heap size is less than
4Gb. See Running on a 64-bit Platform and Still Running Out of
Memory?
for details and possible solutions. Just as with 32-bit, 64-bit
applications may also encounter continuous growth of the native memory.
Use the same process described above to troubleshoot for that case.
Particular to the Java heap space, you may encounter the following OutOfMemoryErrors:
java.lang.OutOfMemoryError: Java heap space

    java.lang.OutOfMemoryError: GC overhead limit exceeded
Unlike native OutOfMemoryErrors that can occur if the Java heap is sized too large, these errors are almost always due to the Java heap being sized too small. The troubleshooting protocol is to first increase the Java heap size and determine if the problem is just delayed or is resolved. If it is resolved, the heap was sized too small. If the problem persists, then you may be looking at a Finalization issue or a Java object leak, which are less common.
Conclusion and Further Reading
This document has described the differences between the Java heap and native heap within a Java process, how one can affect the other, and some of the problems and considerations when managing the native and Java memory for your applications. For additional information on these topics, see the following presentations:
- Troubleshooting Native Memory Leaks in Java Applications
- Troubleshooting Memory Issues in Java Applications
Last reviewed on Sat Feb 01 2025 00:00:00 GMT+0000 (Coordinated Universal Time)