Troubleshooting Long Garbage Collection Pauses
Introduction
The goal of this document is to provide guidance on solving long pauses during garbage collection (GC) with the HotSpot JVM.
Low pause times during an application run is the most important goal for many enterprise applications. This is especially true for transaction-based systems where long latency can result in transaction time-outs. For systems running on the Java Virtual Machine, garbage collections can sometimes be the cause of the long pauses. This article describes different scenarios with long GC pauses and how to diagnose and troubleshoot these GC pauses.
The following sections describe the different situations that can cause long GC pauses during the application run.
Table of Contents
- 1 Insufficient Heap Size
- 2 Fragmentation in the Heap
- 3 Other OS Activities Happening at the Time of GC
- 4 Bug in the JVM
- 5 Explicit System GCs
- 6 Other Troubleshooting Steps
Applies To
Java SE JDK and JRE - Version 5 and later
Any platform
1 Insufficient Heap Size
If the application footprint is larger than the maximum heap space that we have specified for the JVM, it results in frequent collections. Due to the insufficient heap space, the allocation requests fail and the JVM needs to invoke garbage collections in an attempt to reclaim space for the allocations. But since it cannot claim much space with each collection, subsequent allocation failures result in more GC invocations.
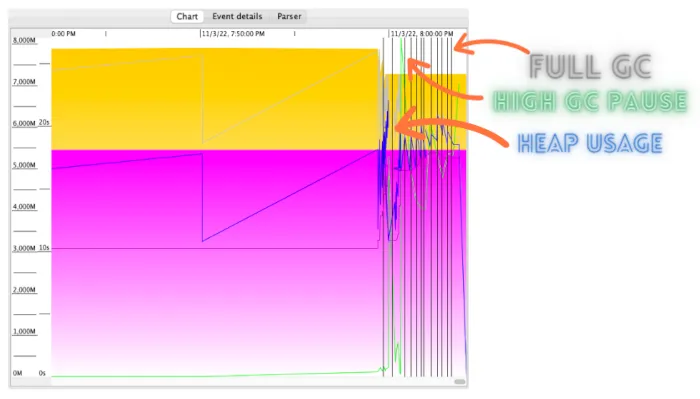
Another common cause, seen even after the heap size is increase, is a memory leak, featured by an increase of heap usage, evidenced after one or two full GC where it’s evident that the heap usage increased, and then the JVM ends up collapsing with an OOM, preceded by a sequence of frequent and inefficient full GCs, as seen in the graph taken by GCViewer.
These frequent Full GCs cause long pauses in the application run. For example, in the following case, the permanent generation is almost full and the allocation attempts into the permanent generation are failing, triggering the Full GCs.
166687.013: [Full GC [PSYoungGen: 126501K->0K(922048K)] [PSOldGen: 2063794K->1598637K(2097152K)] 2190295K->1598637K(3019200K) [PSPermGen: 165840K->164249K(166016K)], 6.8204928 secs] [Times: user=6.80 sys=0.02, real=6.81 secs]

    166699.015: [Full GC [PSYoungGen: 125518K->0K(922048K)] [PSOldGen: 1763798K->1583621K(2097152K)] 1889316K->1583621K(3019200K) [PSPermGen: 165868K->164849K(166016K)], 4.8204928 secs] [Times: user=4.80 sys=0.02, real=4.81 secs]
Similarly, the frequent Full GCs can occur if there is insufficient space in the tenured generation for the allocations or promotions.
The solution for these long pauses is to identify the average footprint of the application and then specify the heap size accordingly.
2 Fragmentation in the Heap
Fragmentation in the Java Heap can cause GCs to occur more frequently and can also sometimes cause long pauses in the GCs. This is more probable in the case of the Concurrent Mark Sweep collector, also known as CMS, where the tenured generation space is not compacted with the concurrent collections. In case of CMS, due to fragmentation in the tenured generation space, the young generation collections can face promotion failures and thus triggering ‘Concurrent Mode Failure’ collections that are stop-the-world Full GCs. Full GCs take a long time to finish as compared to the concurrent collection pauses. Due to the fragmentation, the direct allocations in the tenured generation may fail even when there is lot of free space available and thus causing Full GCs. Fragmentation can also cause frequent allocation failures and thus triggering frequent Full GCs that increase the overall time the application is paused for.
The following logs collected with the CMS collector show that the fragmentation in the CMS generation space is very high. This leads to promotion failure during a young generation ParNew collection and then a ‘concurrent mode failure’. A Full GC is done in the event of ‘concurrent mode failure’ that takes a very long time, 17.1365396 seconds to finish.
Heap before GC invocations=7430 (full 24):
     par new generation total 134400K, used 121348K [0x53000000, 0x5c600000, 0x5c600000)
     eden space 115200K, 99% used [0x53000000, 0x5a07e738, 0x5a080000)
     from space 19200K, 32% used [0x5a080000, 0x5a682cc0, 0x5b340000)
     to space 19200K, 0% used [0x5b340000, 0x5b340000, 0x5c600000)
     concurrent mark-sweep generation total 2099200K, used 1694466K [0x5c600000, 0xdc800000, 0xdc800000)
     concurrent-mark-sweep perm gen total 409600K, used 186942K [0xdc800000, 0xf5800000, 0xfbc00000)
     10628.167: [GC Before GC:

     Statistics for BinaryTreeDictionary:
     ------------------------------------
     Total Free Space: 103224160
     Max Chunk Size: 5486
     Number of Blocks: 57345
     Av. Block Size: 1800
     Tree Height: 36

     Statistics for IndexedFreeLists:
     --------------------------------
     Total Free Space: 371324
     Max Chunk Size: 254
     Number of Blocks: 8591 **<---- High fragmentation**
     Av. Block Size: 43
     free=103595484 frag=1.0000 **<---- High fragmentation**
     Before GC:

     Statistics for BinaryTreeDictionary:
     ------------------------------------
     Total Free Space: 0
     Max Chunk Size: 0
     Number of Blocks: 0
     Tree Height: 0

    Statistics for IndexedFreeLists:
    --------------------------------
    Total Free Space: 0
    Max Chunk Size: 0
    Number of Blocks: 0
    free=0 frag=0.0000
    10628.168: [ParNew (promotion failed)
    Desired survivor size 9830400 bytes, new threshold 1 (max 1)
    - age 1: 4770440 bytes, 4770440 total
    : 121348K->122157K(134400K), 0.4263254 secs]10628,594: [CMS10630.887: [CMS-concurrent-mark: 7.286/8682 secs] [Times: user=14.81 sys=0.34, real=8.68 secs] (concurrent mode failure): 1698044K->625427(2099200K), 17.1365396 secs] 1815815K->625427K(2233600K), [CMS Perm : 186942K->180711K(409600K)After GC:

     Statistics for BinaryTreeDictionary:
     ------------------------------------
     Total Free Space: 377269492
     Max Chunk Size: 377269492
     Number of Blocks: 1
     Av. Block Size: 377269492
     Tree Height: 1

     Statistics for IndexedFreeLists:
     --------------------------------
     Total Free Space: 0
     Max Chunk Size: 0
     Number of Blocks: 0
     free=377269492 frag=0.0000
     After GC:

     Statistics for BinaryTreeDictionary:
     ------------------------------------
     Total Free Space: 0
     Max Chunk Size: 0
     Number of Blocks: 0
     Tree Height: 0

    Statistics for IndexedFreeLists:
    --------------------------------
    Total Free Space: 0
    Max Chunk Size: 0
    Number of Blocks: 0
    free=0 frag=0.0000
    , 17.5645589 secs] [Times: user=17.82 sys=0.06, real=17.57 secs]

     Heap after GC invocations=7431 (full 25):
     par new generation total 134400K, used 0K [0x53000000, 0x5c600000, 0x5c600000)
     eden space 115200K, 0% used [0x53000000, 0x53000000, 0x5a080000)
     from space 19200K, 0% used [0x5b340000, 0x5b340000, 0x5c600000)
     to space 19200K, 0% used [0x5a080000, 0x5a080000, 0x5b340000)
     concurrent mark-sweep generation total 2099200K, used 625427K [0x5c600000, 0xdc800000, 0xdc800000)
     concurrent-mark-sweep perm gen total 409600K, used 180711K [0xdc800000, 0xf5800000, 0xfbc00000)
     }

    Total time for which application threads were stopped: 17.5730653 seconds
3 Other OS Activities Happening at the Time of GC
OS activities, such as swapping, network transactions, or kernel I/O tasks are happening at the same time as GC, and these operations can make the garbage collection pauses last much longer. These pauses can be of the order of a few seconds to some minutes.
Swapping: If your system is configured to use swap space, the operating system may move inactive pages of memory of the JVM process to the swap space in order to free up memory for the currently active process. This may be the same process or a different process on the system. Swapping is very expensive as it requires disk accesses which are much slower as compared to the physical memory access. So, if during a garbage collection the system needs to perform swapping, the GC would seem to run for a very long time.
The following is the log of a young generation collection that lasts for 29.47 seconds because of swapping:
{Heap before GC invocations=132 (full 0):
    par new generation total 2696384K, used 2696384K [0xfffffffc20010000, 0xfffffffce0010000, 0xfffffffce0010000)
    eden space 2247040K, 100% used [0xfffffffc20010000, 0xfffffffca9270000, 0xfffffffca9270000)
    from space 449344K, 100% used [0xfffffffca9270000, 0xfffffffcc4940000, 0xfffffffcc4940000)
    to space 449344K, 0% used [0xfffffffcc4940000, 0xfffffffcc4940000, 0xfffffffce0010000)
    concurrent mark-sweep generation total 9437184K, used 1860619K [0xfffffffce0010000, 0xffffffff20010000, 0xffffffff20010000)
    concurrent-mark-sweep perm gen total 1310720K, used 511451K [0xffffffff20010000, 0xffffffff70010000, 0xffffffff70010000)
    2013-07-17T03:58:06.601-0700: 51522.120: [GC Before GC: : 2696384K->449344K(2696384K), 29.4779282 secs] 4557003K->2326821K(12133568K) ,29.4795222 secs] [Times: user=915.56 sys=6.35, real=29.48 secs]
Corresponding vmstat output at 03:58:
kthr memory page disk faults

 cpu             r b w swap     free     re mf    pi po fr  de sr s0 s1 s2 s3 in    sy    cs    us  sy id

 20130717_035806 0 0 0 77611960 94847600 55 266   0  0  0   0  0  0  0  0  0  3041  2644  2431  44  8  48

 20130717_035815 0 0 0 76968296 94828816 79 324   0  18 18  0  0  0  0  1  0  3009  3642  2519  59  13 28

 20130717_035831 1 0 0 77316456 94816000 389 2848 0  7  7   0  0  0  0  2  0  40062 78231 61451 42  6  53

 20130717_035841 2 0 0 77577552 94798520 115 591  0  13 13  0  0  13 12 1  0  4991  8104  5413  2   0  98
This minor GC takes around 29 seconds to complete. The corresponding
vmstat output shows that the available swap space drops down by ~600mb
during this period. That means during this garbage collection some pages
from the RAM were moved out to the swap space, not necessarily by the
same process running on the system.
From the above, it is clear that the physical memory available on the system is not enough for all the processes running on the system. The way to resolve this is to run fewer processes or, if possible, add more RAM to increase the physical memory of the system. In the case above, the specified maximum tenured generation size is set as 9G and out of that only 1.8G is occupied. So it makes sense to reduce the heap size to lower the memory pressure on the physical memory in order to avoid or minimize the swapping activity.
I/O contention: During a GC, phases of the collection are logged. If the logging is delayed due to heavy I/O activity in the host, the GC activity may be held up waiting for entries to be logged. This situation often presents in the GC log with high real times and lower sys and user times. The user times are usually larger for multiprocessor machines, so you need to divide the user time by the number of processors. Check the system’s top, sar, and/or iostat output to determine if heavy I/O is occurring during the long GCs to verify if this may be the case and what may be causing the heavy I/O. Note that file system flushing can also tie up the I/O resources. Note that file system flushing may be invoked by log rotation.
Network latency: Connection issues or an unresponsive/slow backend server can also cause longer GC times. Check the system’s netstat output during the period of long GCs for any network latency issues.
CPU contention: Long GC pauses coincident to high CPU usage can mean CPU contention may be the culprit. This situation is often presented in the GC log with high sys times and low user times. Check the CPU statistics with the system’s top or mpstat tool to figure out if enough CPU resources were available during the GC pauses.
Multiple resources impacted: Note that these resources are cooperative and interrelate. Therefore, resource starvation in one area may lead to contention in other areas. Consider a situation where your logs are being written across the network. You’ve noticed heavy I/O during some long GCs. In this situation, you need to also consider if network latency may be causing an I/O backup. Now consider the same type of situation where the application responds to such as situation by spinning up more threads, leading to higher CPU utilization and CPU contention.
Virtual Machines and Containers: In containers or virtual systems, the underlying configuration of the container or hypervisor may impact how your application and the JVM interacts with the system resources. Consider a situation where a virtual system’s I/O assignment is configured as pass-through to the hypervisor or a configuration where memory or CPU stealing is configured.
Firmware and Operating System Bugs: It can be a very long, difficult journey to finally root cause a “long GC pause” issue down to a missing firmware or OS patch. Consider the example above in which the hypervisor is responsible for I/O assignment. Now consider that the firmware is missing an update that fixes a bug whereby the hypervisor has random latency in assigning I/O. Consider another situation where a known operating system bug causes network connection or latency issues. These kind of bugs are very difficult for to identify when focused on a GC performance issue. Because issues with hypervisors and other system issues may be fixed with firmware updates, it’s important that both firmware and operating system patches are up to date when troubleshooting system resource issues.
4 Bug in the JVM
Sometimes these long pauses could be due to a bug in the JVM. For example, due to the following bugs in the JVM, Java applications may face long GC pauses.
- 6459113: CMS+ParNew: wildly different ParNew pause times depending
on heap shape caused by allocation spread
- fixed in JDK 6u1 and 7
- 6572569: CMS: consistently skewed work distribution indicated in
(long) re-mark pauses
- fixed in JDK 6u4 and 7
- 6631166: CMS: better heuristics when combating fragmentation
- fixed in JDK 6u21 and 7
- 6999988: CMS: Increased fragmentation leading to promotion failure
after CR#6631166 got implemented
- fixed in JDK 6u25 and 7
- 6683623: G1: use logarithmic BOT code such as used by other
collectors
- fixed in JDK 6u14 and 7
- 6976350: G1: deal with fragmentation while copying objects during GC
- fixed in JDK 8
If you are running with a JVM version affected with these bugs, please upgrade to the version where these bugs are fixed.
5 Explicit System GCs
Attempts to start a garbage collection from an application through the
system.gc() call can result in very long pauses. This is because
system.gc() calls invoke full, stop-the-world garbage collection runs.
Whether from your own code or from a third party module, you should
attempt to reduce or eliminate such calls.
164638.058: [Full GC (System) [PSYoungGen: 22789K->0K(992448K)] [PSOldGen: 1645508K->1666990K(2097152K)] 1668298K->1666990K(3089600K) [PSPermGen: 164914K->164914K(166720K)], 5.7499132 secs] [Times: user=5.69 sys=0.06, real=5.75 secs]If you are using Remote Method Invocation (RMI) and are observing explicit full GCs on a regular basis, then these are coming from the RMI implementation that triggers system.gc() at regular intervals. This interval can be configured using the following system properties:
-Dsun.rmi.dgc.server.gcInterval=n -Dsun.rmi.dgc.client.gcInterval=nThe default value for these properties in JDK 1.4.2 and 5.0 is 60000 milliseconds, and 3600000 milliseconds in JDK 6 and later releases.
If you want to disable the explicit full GCs invoked using
system.gc(), run the application with -XX:+DisableExplicitGC JVM
option.
6 Other Techniques
-
Enable GC Logging. The GC logs can give you details on the nature and the frequency of the GC pauses. That is, they can provide answers to the questions like “are the long GC pauses occurring during young collections or old collections” and “how frequently those collections are encountering long pauses”.
In the case of the CMS collector, add the-XX:PrintFLSStatistics=2option as well.- Java 8:
-Xloggc:/tmp/gc.log -XX:+PrintGCDetails -XX:+PrintGCTimeStamps -XX:+PrintGCDateStamps -verbose:gc - Java 9:
- G1:
-Xlog:gc*:time,gc+phases=debug:file=/tmp/gc.log - non-G1:
-Xlog:gc*:file=/tmp/gc.log
- G1:
- Java 11:
-Xlog:gc=debug:file=/tmp/gc.log:time,gc+phases,uptime,level,tags:filecount=5,filesize=100m - JRockit:
-Xverbose:gc,gcpause,memdbg -XverboseTimeStamp
See also “Garbage Collector Implementation” in the JDK 17 GC Tuning Guide.
- Java 8:
-
Monitor the overall health of the system using OS tools like
vmstat,iostat,netstat, andmpstaton Solaris and Linux platforms. Use tools like Process Monitor and Task Manager on the Windows operating system. -
Use tools like GCHisto, GCViewer or GCLogViz to visually analyze the GC Logs and figure out which GCs are taking a long time and if there is a pattern in the occurrence of these collections. If the pattern corresponds to a memory leak, one or more heap dumps could help to determine which classes are part of the problem.
-
Try to see from the GC logs if there are any signs of fragmentation in the Java Heap space.
-
Monitor if the specified Heap size is enough to contain the footprint of the application.
-
Check if you are running with a JVM that has a known bug related to the long GC pauses and then upgrade if that bug is fixed in a later version.
-
If you conclude the pattern found is matching with a memory leak, or if some of the cycles ends up with an
OutOfMemoryError, obtain a heap dump to justify it, and create a ticket with Support to investigate. ith a JVM that has a known bug related to the long GC pauses and then upgrade if that bug is fixed in a later version. -
If you conclude the pattern found is matching with a memory leak, or if some of the cycles ends up with an
OutOfMemoryError, obtain a heap dump to justify it, and create a ticket with Support to investigate.
Last reviewed on Sat Feb 01 2025 00:00:00 GMT+0000 (Coordinated Universal Time)